XDR Metrics
XDR stands for Extended Detection and Response. The XDR metrics page provides a comprehensive overview of trial performance, feature usage, and integration usage.
You can filter data by the following time frames:
-
Last 24 hours
-
Last 7 days
-
Last 30 days

Acceess the XDR Metrics Page
Access the XDR metrics page by selecting XDR under the Metrics tab.
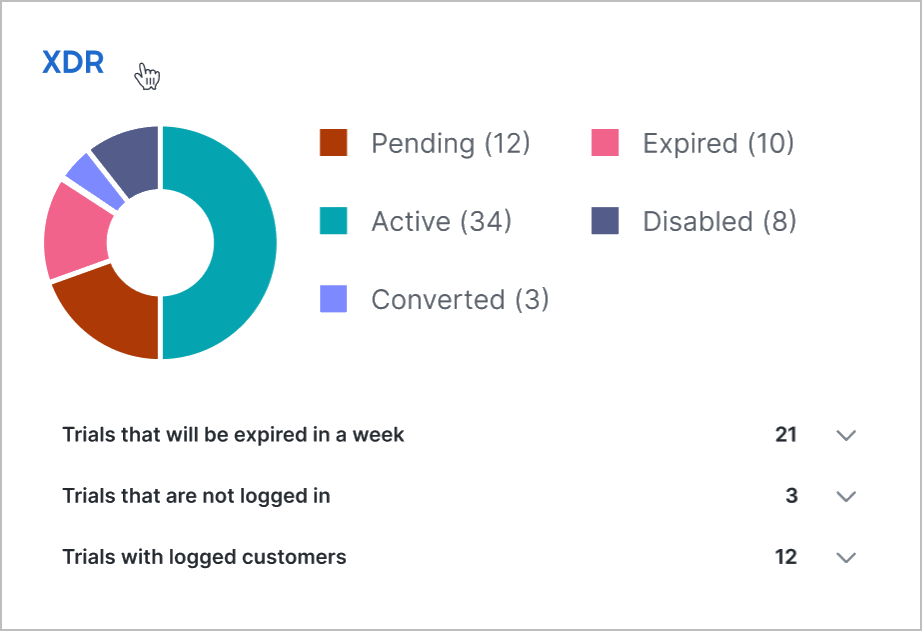
Alternatively, if you are already on the General metrics page, selecting the title of the XDR section redirects you to the XDR metrics page.

Summary Metrics
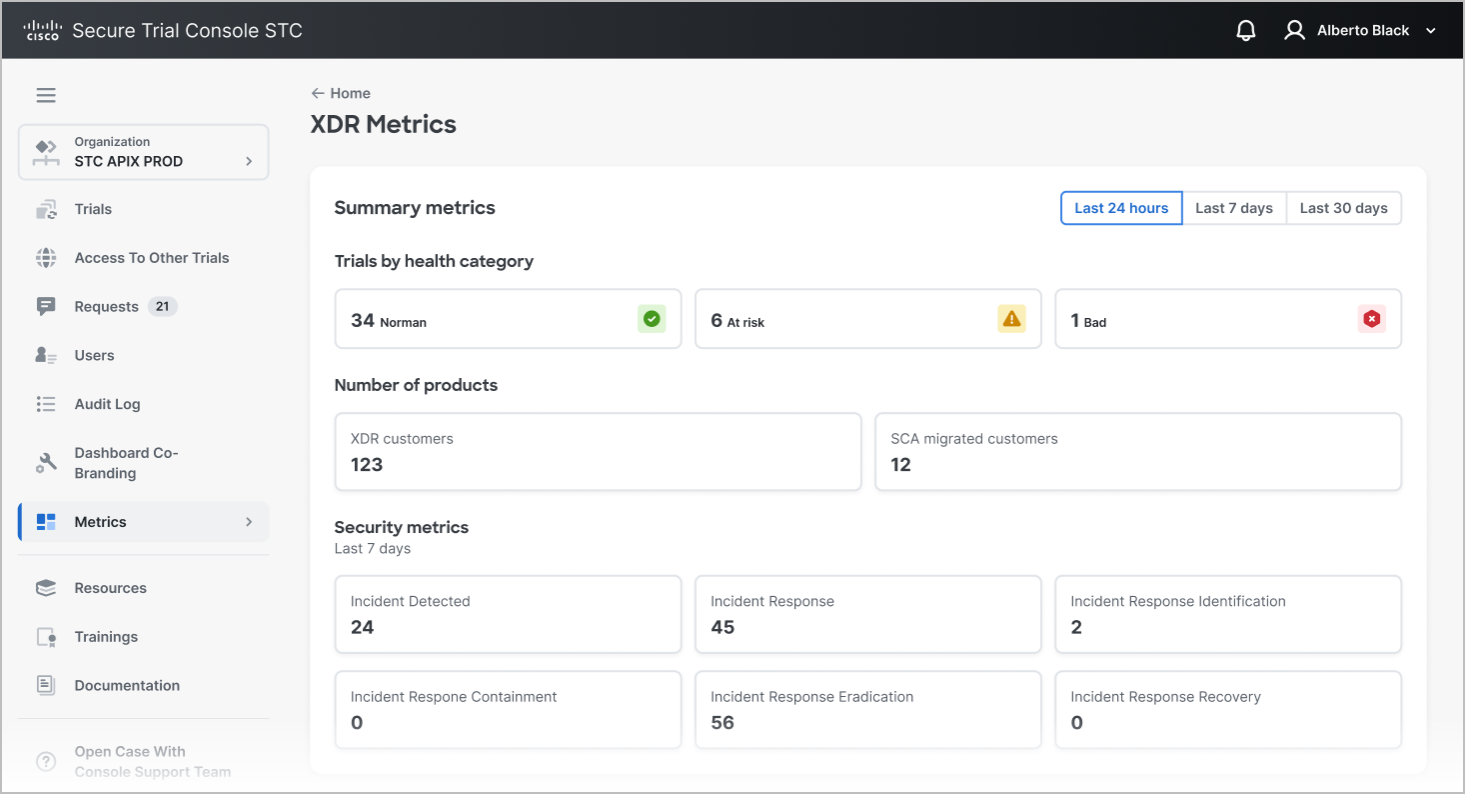
The Summary section provides an overview of key trial performance indicators:
-
Trials by health category: Displays trial counts by health status—normal, at risk, and bad.
-
Number of products: Displays metrics related to the number of XDR customers and Secure Cloud Analytics (SCA) customers who have been provided with access to XDR.
-
Security metrics: Displays key incident-related data for the last 7 days, including the number of detected incidents and responses across various stages: identification, containment, eradication, and recovery.
Weekly Usage Details
The Weekly usage details section provides a summary of system interactions and activities over the past week. It includes metrics on accessed features and executed actions. Additionally, it tracks interactions with assets.
Integrations
The Integrations section displays a table summarizing configured modules. It includes the module name, its attribution (indicating whether the module is provided by a third-party organization or by Cisco), and the number of customers using each module.